Will midterm elections drive mayhem in the markets? The upcoming midterm elections promise to be among the more interesting in recent decades. The Republicans can take comfort in elections generally being about “…the economy, stupid!” Unemployment is at multidecade lows and wages are trending higher.
On the other side, Democrats can point to the administration’s lack of progress on trade, President Trump’s below-average approval ratings, and the number of House of Representatives seats historically lost in a president’s first midterm election (~29 based on the past 13 such elections over 100-plus years, according to Strategas Research Partners).
While historical patterns, recent polling data, and betting sites suggest odds slightly favor that the House flips, what does that potentially mean for policy, and how might markets react? We take a look here.
POLITICAL TAILWIND?
As stock investors, we have mixed emotions about the upcoming midterm elections. On the one hand, historically, stock market volatility increased ahead of the elections due to policy uncertainty. However, stocks also tended to rebound strongly coming out of midterm election-year lows.The S&P 500 has been higher one year after the midterm election than it was on midterm election day every time since 1946. We are now entering the most favorable part of the four-year presidential cycle.

The upcoming year (post midterms, pre-election) has historically been the best of the four-year cycle, in part because of presidents’ efforts to boost the economy with pro- growth policies ahead of the election in year four. While we are not ready to make any market predictions for 2019, the political calendar is encouraging and we would look at any volatility driven by policy uncertainty ahead of the midterm elections as an opportunity. This historical pattern is hard to ignore, while the economic backdrop is favorable and corporate fundamentals are quite healthy.
IS GRIDLOCK GOOD?
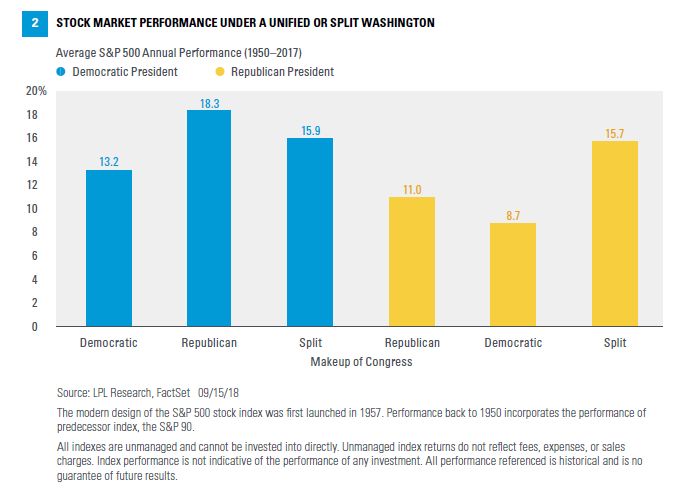
We often get the question: What political leadership combination in Washington, D.C., is best for the stock market? This is an easy question to answer by looking at historical returns, which we have done in Figure 2. A Democratic president and Republican-controlled Congress has been the best combination for the S&P 500, followed closely by a Democratic president and split Congress. A divided Congress under a Republican president, a reasonable prediction for the outcome this November, has also been a good environment for stocks historically. On the other end of the spectrum, a Republican president and Democratic-controlled Congress (possible but unlikely in November) has produced the weakest average returns.

It is difficult to say whether we can we apply this history to the upcoming elections. Regardless of which side of the political aisle you land on, the stock market has performed well since President Trump took office with Republican majorities in the House and Senate (the S&P 500 has risen 29% since the start of 2017 through September 17, 2018). Stocks seemed to like tax reform. So perhaps the status quo wouldn’t be so bad.
But the stock market tends to like gridlock better because it takes away the extremes and does not disrupt the status quo. So maybe stocks would prefer a Democratic-controlled House. (The House flipping may be more likely than the Senate flipping based on polling data and discussions with Washington insiders). We won’t take sides here, but if you assume tax reform is the administration’s most impactful policy change for the stock market, then the midterm election outcome may not be a big market mover. In addition, the president can act unilaterally on trade, muting the market impact of the midterm election. Finally, the fundamentals of the economy and robust corporate profits should overwhelm the impact of any midterm election outcome.
KEY POLICY IMPLICATIONS
We see several potential policy implications from the various midterm election outcomes:
Taxes. If Republicans maintain control of the House and Senate, they would likely soon pursue what is being referred to as tax reform 2.0, which would make the individual tax cuts passed in December 2017 permanent (they are currently slated to sunset in 2026). They may also pursue indexing capital gains taxes to inflation, improving any potential after-tax returns for stock investors.
Should Democrats take control of one or both chambers, they may try to increase taxes, bolstered by a growing deficit that they may blame on Republican tax cuts. We think getting a tax hike through is very unlikely, but the Democrats could use the debt ceiling as leverage (like Republicans did in 2010-11 to try to get spending cuts). Congress must raise the debt ceiling in 2019, with 60 votes required in the Senate.
Infrastructure
This was an area many thought President Trump and the Democrats could work together on. That proved more difficult than expected in the initial attempt last year and nothing was done. Should the Democrats win the House, with the debt ceiling as leverage, they may look to repeal a portion of the corporate tax cuts to fund infrastructure spending. A carbon tax is another possible funding source for a Democratled infrastructure spending push, which could boost infrastructure stocks such as construction and building materials.
Healthcare
A strong performance by the Democrats, both nationally and at the state level, could lead to an expansion of Medicaid, which would benefit health insurers and hospitals. In addition, efforts to control high drug prices may intensify if the Democrats take control of Congress. Headline risk surrounding drug price controls has led us to be a bit more cautious on the pharmaceutical industry.
Defense
Defense spending is headed higher in the near term regardless of what happens in November. But the trajectory may be more gradual should the House or Senate flip.
Energy
Republican leadership would be expected to be friendlier to energy production, which could put downward pressure on oil prices. At the same time, the Trump administration under the status quo may get more aggressive with Iran and Venezuela, possibly building in a price cushion.
CONCLUSION
Midterm elections will be closely watched. The political makeup of Congress could possibly change, which has meaningful policy implications that could move markets. Though we may see market volatility ahead of the results due to the policy uncertainty, we would expect the political calendar to provide a tailwind for stocks over the coming months. The economic and corporate profit backdrop remains favorable, and our bias remains that the United States and China will reach a trade deal shortly after the midterms. Trade risks remain, as does the potential for a policy mistake by the Federal Reserve or more flare ups in weaker emerging market countries.
Sincerely,
Joe Garrett
President and CEO
Clay Robinson
President and CFO
IMPORTANT DISCLOSURES
The opinions voiced in this material are for general information only and are not intended to provide specific advice or recommendations for any individual. To determine which investment(s) may be appropriate for you, consult your financial advisor prior to investing. All performance referenced is historical and is no guarantee of future results.
The economic forecasts set forth in the presentation may not develop as predicted and there can be no guarantee that strategies promoted will be successful.
Investing in stock includes numerous specific risks including: the fluctuation of dividend, loss of principal, and potential liquidity of the investment in a falling market.
Because of its narrow focus, specialty sector investing, such as healthcare, financials, or energy, will be subject to greater volatility than investing more broadly across many sectors and companies.
All investing involves risk including loss of principal.
All indexes are unmanaged and cannot be invested into directly. Unmanaged index returns do not reflect fees, expenses, or sales charges. Index performance is not indicative of the performance of any investment.
INDEX DESCRIPTIONS
The Standard & Poor’s 500 Index is a capitalization-weighted index of 500 stocks designed to measure performance of the broad domestic economy through changes in the aggregate market value of 500 stocks representing all major industries.
This research material has been prepared by LPL Financial
To the extent you are receiving investment advice from a separately registered independent investment advisor, please note that LPL Financial is not an affiliate of and makes no representation with respect to such entity.
Not FDIC or NCUA/NCUSIF Insured | No Bank or Credit Union Guarantee
| May Lose Value | Not Guaranteed by any Government Agency |
Not a Bank/Credit Union Deposit
Member FINRA/SIPC


