| The Dow joined the S&P 500 in reaching fresh new highs last week. The record came after a drought lasting nearly eight months. The blue chip index has lagged the S&P 500 Index and Nasdaq Composite this year amid escalating trade tensions, which have weighed on the larger multinational U.S. companies that make up most of the 30-stock Dow Jones Industrial Average (Dow). This week, we’ll discuss the impact of the Dow’s new high and whether stocks have enough support from economic growth and corporate profits to build on recent gains.
NEW HIGHS TEND TO PRECEDE MORE NEW HIGHS 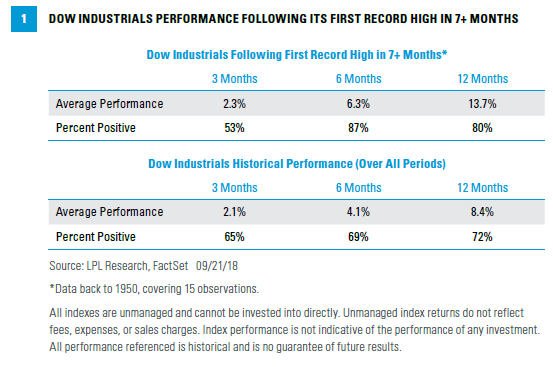 A new high for the Dow also may be a positive economic signal. Based on data back to 1950, within six months of a Dow record high, a U.S. recession occurred less than 1% of the time. Over the subsequent year, the occurrences haven’t been much higher, at 2.2%, compared with about 13% during any time in the period covered. SUPPORTIVE DATA So why have stocks done so well? We think the continued strength of the U.S. economy is the biggest reason. Some of the highlights:
Some segments of the U.S. economy are cooling, including housing and autos, and we acknowledge the risk associated with further escalation of trade tensions. However, we expect the positive impact of fiscal stimulus, including tax reform and increased government spending, to more than offset these
potential drags on growth and help support continued gains in stocks. MORE STRONG PROFIT GROWTH AHEAD
Strong profit growth has also helped buoy the stock market in recent months. After two quarters of annual S&P 500 earnings growth over 25%, a 22% increase is expected in the third quarter (which ends this week), followed by an expected 20% increase in the fourth (according to Thomson Reuters). Although the earnings growth rate may slow a bit in the second half, the strong economic backdrop-notably high manufacturing and business confidence-is likely to support continued solid earnings gains through year-end and into 2019. We plan to preview earnings season here within the next two weeks. 10-YEAR YIELD BREAKS 3%
Recent gains in the stock market are also encouraging given rising interest rates. Since August 24, the 10-year yield has moved from 2.81% to 3.06% while the S&P 500 is up about 3%. So should investors be worried about a further rise in rates? As long as the potential move is fairly gradual, as we expect, we don’t think so. Historically, as shown in Figure 2, stocks have done quite well when rates rise-particularly over the past three decades. In fact, since 1996, stocks have risen with higher rates every single time (12 out of 12 times). Since 1962, the S&P 500 has gained an average of 6.1% during the rising rate periods, with gains in 83% of those periods (average increase in yield of 2.2%, average length of time of 13 months). 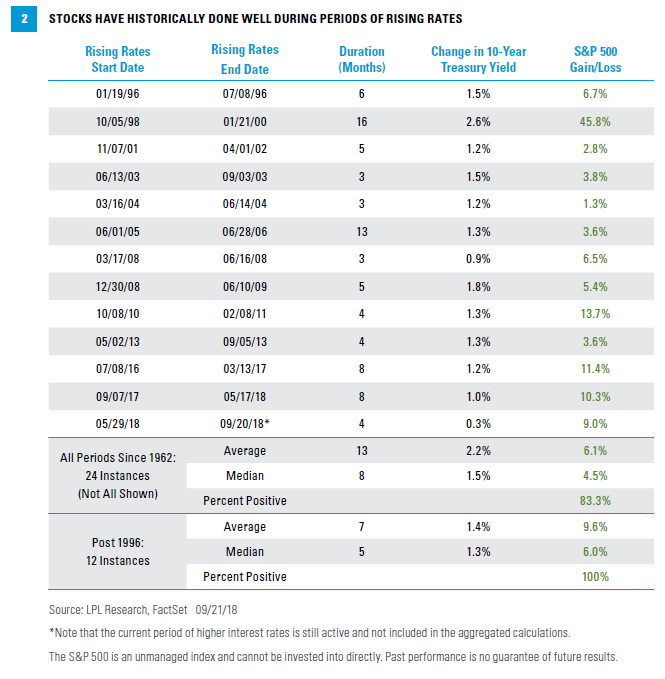 Bottom line, we do not see rising interest rates as a reason to sell stocks, particularly in the absence of runaway inflation. The market is interpreting higher rates as a response to better growth, not as a reason to fear a policy mistake, which we find encouraging.
CONCLUSION
Last week the Dow Industrials joined the S&P 500 and Nasdaq at fresh record highs, supported by a favorable outlook for the U.S. economy and corporate profits. Even though the S&P 500 is within the range of our year-end forecast (2,900- 3,000)*, we still believe the economic and profit backdrop is strong enough to support further gains. We could see more volatility around trade policy, midterm elections, higher inflation, or pockets of stress in emerging markets. |
|
Sincerely,
Joe Garrett
President and CEO
Clay Robinson
President and CFO
|
|
|
|
IMPORTANT DISCLOSURES
The opinions voiced in this material are for general information only and are not intended to provide specific advice or recommendations for any individual. To determine which investment(s) may be appropriate for you, consult your financial advisor prior to investing. All performance referenced is historical and is no guarantee of future results.
The economic forecasts set forth in the presentation may not develop as predicted and there can be no guarantee that strategies promoted will be successful.
Investing in stock includes numerous specific risks including: the fluctuation of dividend, loss of principal, and potential liquidity of the investment in a falling market.
All indexes are unmanaged and cannot be invested into directly. Unmanaged index returns do not reflect fees, expenses, or sales charges. Index performance is not indicative of the performance of any investment.
Bonds are subject to market and interest rate risk if sold prior to maturity. Bond and bond mutual fund values and yields will decline as interest rates rise and bonds are subject to availability and change in price.
Treasuries are a marketable, fixed-interest U.S. government debt security. Treasury bonds make interest payments semiannually and the income that holders receive is taxed only at the federal level.
|
|
|
| INDEX DESCRIPTIONS Dow Jones Industrial Average (DJIA), or DOW, is the most widely used indicator of the overall condition of the stock market, a price-weighted average of 30 actively traded blue chip stocks, primarily industrials. The 30 stocks are chosen by the editors of the Wall Street Journal. The Dow is computed using a priceweighted indexing system, rather than the more common market cap-weighted indexing system.
The Nasdaq Composite Index measures all Nasdaq domestic and non-U.S. based common stocks listed on the Nasdaq Stock Market. The market value, the last sale price multiplied by total shares outstanding, is calculated throughout the trading day, and is related to the total value of the Index.
The Standard & Poor’s 500 Index is a capitalization-weighted index of 500 stocks designed to measure performance of the broad domestic economy through changes in the aggregate market value of 500 stocks representing all major industries.
|
|
|
|
This research material has been prepared by LPL Financial
To the extent you are receiving investment advice from a separately registered independent investment advisor, please note that LPL Financial is not an affiliate of and makes no representation with respect to such entity.
|
|
Not FDIC or NCUA/NCUSIF Insured | No Bank or Credit Union Guarantee
| May Lose Value | Not Guaranteed by any Government Agency |
Not a Bank/Credit Union Deposit
Member FINRA/SIPC
|